Documentation
Heat Pump Optimizer dashboard card
custom:heatpump-optimizer-card is a self-contained Lovelace card that plots the
optimizer's planning series in three panels stacked on one shared time axis,
each panel with its own scale:
- Price (per kWh in your currency)
- Electricity price (stepped filled area)
- Solar irradiance (dashed stepped area): a relative curve behind the price, with no axis of its own; the tooltip gives it in W/m²
- Heating power (kW)
- DHW heating power (stepped filled band)
- Space heating power (stepped filled band)
- Actioned power — what the heat pump actually did, left of "now" when
you pan back through it: a mode band along the base of the panel for the
hours the pump was executing heating (from the action sensor's own
recorded state history, which every install has), and the commanded power
in kW above it on installs whose action sensor publishes a
power_kwattribute - Silent window and Off window — a band along the top of the panel for steps the plan assumed as silent or off, from the plan sensor's resolved actions. The chips appear only while those steps exist.
- Temperatures (°C)
- Outdoor temperature (smooth dashed-blue line)
- DHW tank temperature (smooth line, with the prediction's expected error drawn as a dashed pair around it)
- House temperature (smooth line; upper/lower zones drawn as dashed lines when the house is configured as two-zone)
Every series has one clickable legend chip — one per series, including the house-temperature series when it draws its two zone lines as well, because visibility is per series and hiding one line of a series is not something the card can do. The chip's hover text names the extra traces that ride on it; the crosshair tooltip is where they are told apart, with a row per line. Toggling a chip hides/shows the series and rescales its panel to the visible data; a panel with nothing visible gives its height to the others.
The chart is drawn as hand-written inline SVG — there is no dependency on Chart.js, ApexCharts, npm or any CDN.
A vertical "now" marker is drawn at the current time across all three panels, and hovering (or touching) the chart shows a crosshair through every panel and a tooltip with the value of every visible series at the nearest sample, plus why the plan is heating at that moment, or, on a step where it is not heating, why it most likely left that step idle.
The colours are chosen per panel, with a light and a dark set, so that every pair of series in one panel stays apart for readers with deuteranopia, protanopia or tritanopia, and every series reads at 3:1 against its panel.
The card at a glance

The screenshots on this page are the shipped card, rendered in a headless
browser against the solved plan the chart figures use, in the theme your
browser prefers. HPO_PAGES_OUT=docs/img/card node tests/card_browser.mjs
re-takes all of them, light and dark.
The header and its status pill
The title sits after the integration's mark: a dusk line falling through the cheap hours of the night with the heat it plans pooled under it. After the title, a pill says in one word what the plan is doing, in this order of precedence:
| Pill | When |
|---|---|
| Manual plan until HH:MM | You applied a plan by hand; it holds until the time shown. |
| Fallback: pump's own curve | Neither plan sensor has a plan, so the optimizer actuates nothing and the pump follows its own heating curve. |
| Plan stale | No new plan for longer than three solve intervals, and never less than 90 minutes: the same rule the integration uses to stop acting on an old plan. |
| Heating now | A plan step is heating right now. |
| Idle | The plan is current and nothing is heating at this moment. |
Hovering the stale or fallback pill says what the pump does meanwhile. With no plan sensor at all the pill is left out, because the card's diagnostics already say why.
The stat tiles
Four tiles sit under the header: the price now, the planned heating (the electricity the plan expects the heat pump to draw over the plotted plan, in kWh), the plan cost of that electricity, and the indoor temperature from the sensor the card's history uses. Each is drawn only when its source publishes a value, and the indoor tile redraws whenever that sensor reports. The tiles sit two across at every width, so a narrow dashboard column never breaks a unit mid-word, and the same tiles head the enlarged view's Plan page.
The legend
The legend is a row of compact chips, one per series; on a phone it is a single row you scroll sideways. Under it, a one-line footnote names what the dashed lines mean, with the full explanation further down this page.
Reading the chart
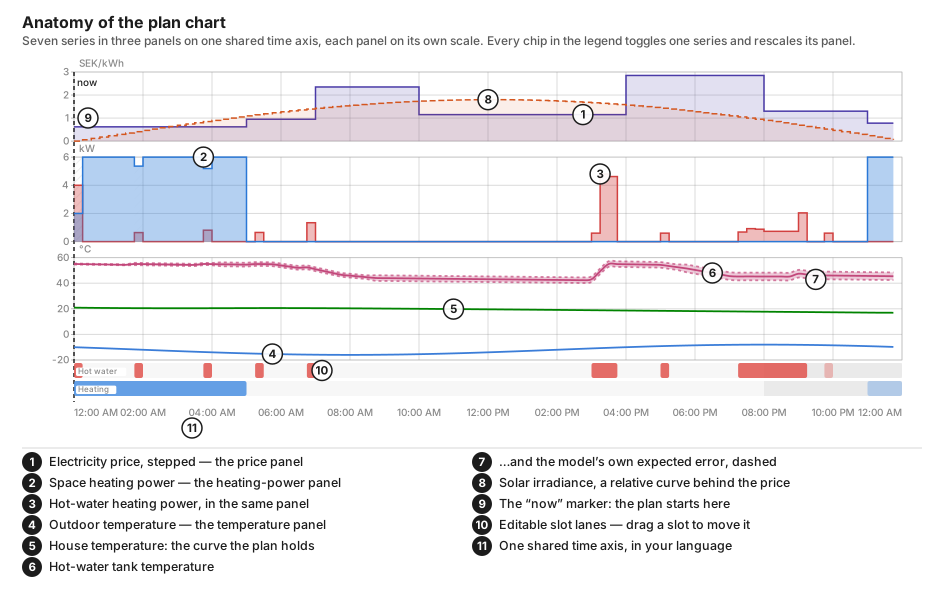
Every figure on this page is the card's own drawing, not an artist's: the chart
figures come from docs/img/card/make_card_figures.mjs and the schematics further
down from tests/setup_qa_render.mjs, both run against a plan
tests/plan_view.py solved. The two photographs further down — the weekly
band and the Advisor page — are the shipped card itself, rendered in a
headless browser against the same solved plan. Every picture here is the card
this release ships.
The two kinds of dashed line
Two series draw a dashed pair beside their solid curve, and they mean entirely different things.
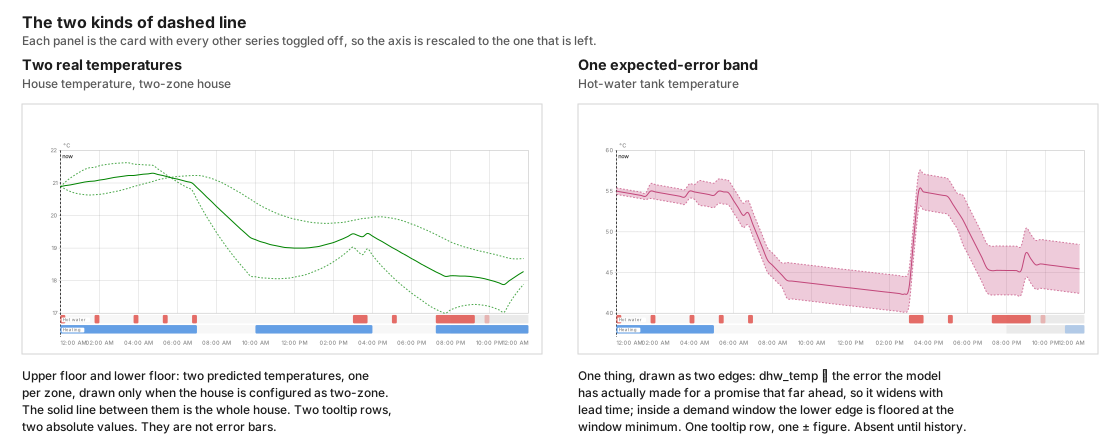
The house temperature's dashed lines are the upper and lower floor: two real predicted temperatures, one per zone, drawn whenever the house is configured as two-zone. They are not error bars. The solid line between them is the whole-house temperature the optimizer plans against. Both are named in the series chip's hover text and each gets its own tooltip row, and the lower one reads Lower floor (modelled) when no sensor measures it.
The DHW tank temperature's dashed lines are the prediction's expected
error — how far the tank curve has historically been out at that distance
ahead. The published band is dhw_temp ∓ the average error the model has
actually made for a promise that far in advance, so it widens the further into
the plan you look. It is absent entirely until there is history to draw it
from: a fresh install, or a house with no tank temperature sensor configured,
publishes no band rather than a zero-width one.
The card then overlays two display-only rules, without rewriting the plan sensor: when the live tank sensor is available, the first visible sample is that reading with no envelope (there is no σ(0) in the record; the table's nearest bucket is 1 h); and inside a configured demand window the lower dashed edge is floored at the window minimum so the band cannot read as missing a window the plan just guaranteed. Outside the windows the published lower edge is left alone. A planned heat is not treated as a new measurement.
The windows that band follows are the resolved schedule the plan was actually made against. A weekly hot-water schedule — different windows per weekday — resolves to one day's windows at a time, so the floored stretch follows each timestamp's own weekday across midnight instead of repeating one day's pattern:
One resolved schedule — weekdays 07:30-08:30, weekend 19:00-21:00 — two
days of it. Friday's dashed edge is held at or above the 45 °C minimum
through its morning window, pinned to 45 °C where the published band dipped
below; Saturday's evening window clamps its edge to 45 °C for the whole two
hours, while Friday's evening — outside any window — runs free. No flat,
every-day schedule draws this picture. The schedule
editor still edits the
configuration itself, not this resolved view.
Unlike the two floors, the band's two edges are one thing. They are named once — Hot water, expected error — in the tank chip's hover text, and they produce a single tooltip row stating one ± figure rather than two absolute temperatures. That hover text also carries the sentence explaining what the dashes mean, which is the one place a puzzled reader looks. Where the band has no value the dashed lines simply stop, rather than bridging the gap, and a band with no width at all is not drawn: an envelope lying exactly on the curve would claim a precision the record has not earned.
The headline row
Under the stat tiles sits a second row: projected savings for the current
plan, with the percentage beside it when the integration publishes one, and
the optimization score out of 100, drawn as tiles like the ones above, then
every line of the plan narrative: the energy and money spent for each
reason, ordered by spend, then the hours the plan leaves idle. The lines are
the narrative sensor's own, already in Home Assistant's language. Set
show_stats: false to leave out both rows.
Clicking the score opens its breakdown: one row per part of the score, each
followed by the drivers that moved it, in points — for the heat pump, a COP
below its own history, or matches its own COP history; for the driving,
energy bought below or above that day's mean price, or bought at the day's
flat mean price; for the house, its configured heat loss against what is
typical for its type and era, and the learned heat loss against the
configured one. A heat pump part that has no grade yet shows its evidence
instead: the COP samples per outdoor temperature band against the number
needed, and how many were refused while learning was frozen. No evidence
yet — not a zero. marks a part with nothing to grade. Hovering a row repeats
its line and says what that part measures. The drivers come from the score
sensor's machine_drivers, operation_drivers and envelope_drivers
attributes, and the evidence from machine_evidence.
The row also carries Why now: the reasons weighing on the current hour's
plan, one line each, largest first, read from the space-heating plan
sensor's why_now attribute. Each line names the reason — Price rank,
Comfort floor, Mold guard, Away or Forecast — with an arrow
(↑ pushes the heat pump toward running, ↓ toward idle, · no effect now) and its
share of the hour's total push in percent; hovering a line explains the
reason. The plan weighs the whole day's hours together, so the heat pump can
still do the opposite of the strongest push this hour. No data means the
optimizer has no plan for this hour yet, before the first solve or while the
price forecast is missing.
Every part is optional, because every source sensor is. The score has no value until enough history exists, the savings sensors go blank between optimizer runs. A row with nothing to say draws no chrome at all rather than an empty strip.
The card finds those sensors from the plan sensor it has already resolved: it
takes that entity id's prefix and appends _plan_predicted_savings,
_plan_savings_percentage, _plan_optimization_score and _plan_narrative. If you have
renamed one individually, it falls back to scanning for any sensor whose id
ends in the suffix it wants. A savings or score sensor registered with the
suffix that has no _plan in it (_predicted_savings, _savings_percentage,
_optimization_score) is covered too: the card tries that form after the
_plan_ one. The savings figure is labelled with the unit the
savings sensor itself declares — nothing here converts, so a currency: in the
card config does not relabel it.
The solar irradiance curve
Irradiance is a fourth unit. It is drawn in the price panel as a dashed, relative curve whose scale tops out a little over half way up the panel, so it shows when the sun is up without competing with the price in front of it, and it costs the chart no axis width. Hovering gives its value in W/m².
Reason codes and estimated prices
Hovering a planned slot shows why it was chosen: cheapest hours, holding the minimum temperature, pre-heating before colder weather, using solar surplus, the anti-legionella cycle, and so on — or simply keeping the house at target, which is what an ordinary slot says; it never borrows the weather pre-heat label. Without this an unexpected slot is indistinguishable from a bug.
Why a step is idle

Hovering a step where a channel is not heating says why the plan left it idle. A channel counts as heating only on a step where the plan runs the pump, space heating and hot water together above 0.1 kW, and that channel's own share is above 0.05 kW; a smaller planned draw is idle, not a slow run. When the plan publishes an exact reason for that step the heading says Because and the list is that reason: the other channel has the capacity, the fuse limit caps heating, the plan is waiting for solar, the hour is dearer than the hours used, or the temperature is above the floor and the plan is coasting. Otherwise the heading says Likely because, and each line comes from what the plan sensors publish for that step and nothing else:
- the step's price, when it is among the dearer half of the plan's horizon, with the share of the horizon that is at least as dear and the cheapest price in it;
- the last run before it, which the house is coasting on, or when the tank was last heated;
- the next run of that channel, with its time and price;
- on a hot-water step, the planned tank temperature, when it is above the hot-water minimum the integration publishes;
- a solar surplus expected later in the horizon.
When both channels are idle at that step they share one list. An exact reason is said once, the most specific first, and on a small card the list drops its last line rather than clipping it. The inferred list says the price once. A step none of these fits gets no explanation rather than a guessed one.
The tooltip stays inside the chart: past the middle of the chart it opens to the left of the crosshair, and it is never taller than the chart. On a small dashboard card the list is shortened, last reason first, to what fits; the enlarged view has room for all of it.
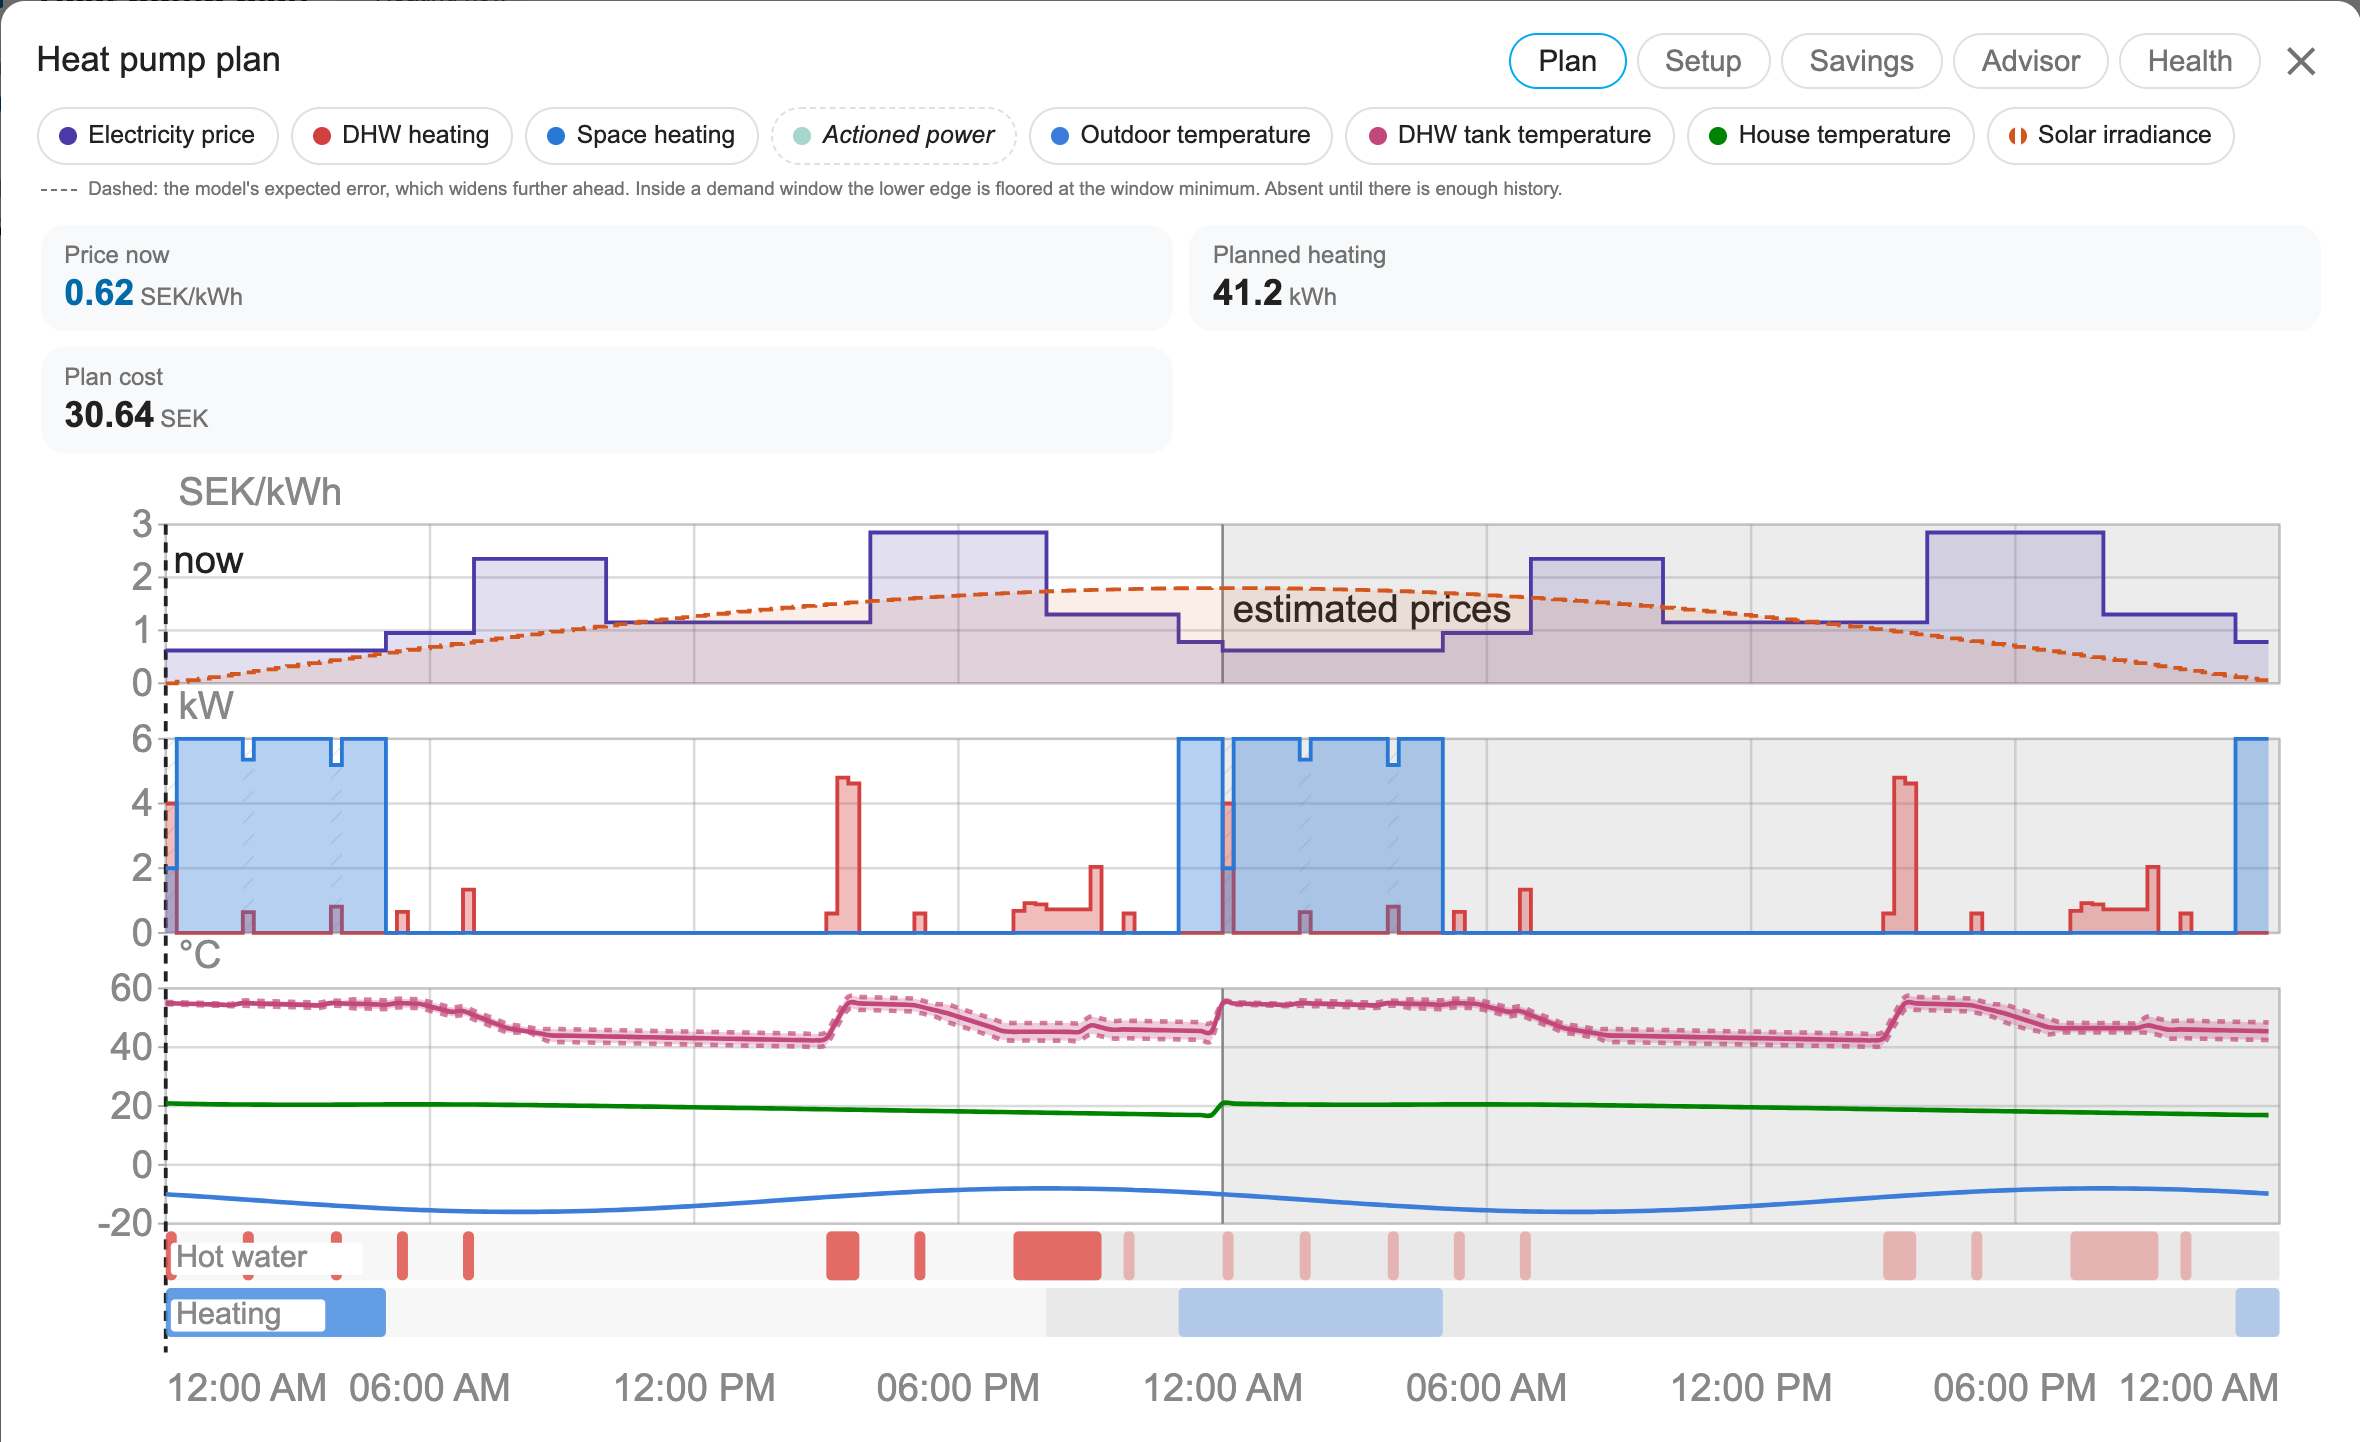
The stretch of the horizon whose prices have not been published yet — Nord Pool and Tibber release tomorrow around 13:00 — is shaded and labelled estimated prices. Those hours rest on the integration's learned daily price shape rather than on market data, and a plan that looks identical either way cannot be audited.
Language and currency
Every string the card draws lives in one table inside the card file, in English,
Swedish and German — the same keys in every language, with no translated entry
missing.
The active
language follows hass.language, so sv-SE selects Swedish, de-DE (or
de-AT, de-CH) selects German, and any language
without a dictionary renders in English; a key missing from a translation falls
back to its English text rather than to a blank. Switching the Home Assistant
language re-renders the card without a reload. Times in axis labels and slot
descriptions are formatted for that same language.
Deliberately not translated: entity ids, config keys, service and attribute names, reason codes, and the messages the card writes to the browser console. Those are contracts, not prose.
The default title is localized too, so a Swedish install shows
Värmepumpsplan and a German one Wärmepumpenplan where an English one shows
Heat pump plan. Set title:
yourself and yours wins in every language.
Prices are labelled with the first currency the card can find:
currency:in the card config.- The
currencyattribute the plan sensors publish. - Home Assistant's own configured currency.
SEK, as a last resort.
That currency labels the price axis, the tooltip and the slot editor's running total. It relabels; it does not convert.
Enlarging the chart
A dashboard card is usually too small to read a 48-hour plan comfortably. Clicking anywhere on the card, or the expand button in its header, opens the same chart in a large modal overlay, drawn at a larger font.

The time axis is labelled as often as a label fits, worked out from how wide a label is against how much room an hour gets, then snapped to an interval that divides the day — 1, 2, 3, 4, 6, 8, 12 or 24 hours — so the labels land on the same clock times each day rather than drifting across midnight. Each labelled hour also gets a vertical gridline in every panel. Zoom in, or plot fewer hours, and more of them are labelled. The editor, panning and zooming all work on that one time axis, whichever panel the pointer is over.
Clicking a legend chip only toggles that series; it does not open the overlay. Toggles work inside the overlay too, and the visibility state is shared with the card underneath. Close it with the X, the Escape key, or by clicking outside it.
The chart and the chrome around it scale differently, because they are different kinds of thing.
The chart is drawn in a fixed 900x380 coordinate system and stretched to fill whatever space it is given, so its text grows with it for free — the same label renders around 6px in a dashboard column and around 20px in a dialog. Its size is not a free preference, though: the margins, tick spacing and legend rows are authored in those same units against a font of about 10, so raising the font without moving everything else makes labels collide.
The header, legend, tooltip and schedule editor are plain HTML and cannot scale
by themselves. They are sized in em, and the card sets the single font size
they derive from once the dialog has been laid out, from its measured width and
clamped at both ends. Container query units would say this in CSS alone, but
container-type: inline-size also applies inline-axis containment, which is a
large side effect for a font size.
Panning and zooming the plan window
Pinch to zoom, or hold Ctrl and scroll. Swipe sideways with two fingers to pan, hold Shift and scroll, or drag the chart background.
A small row of buttons overlays the top of the chart: zoom out, zoom in, and back to the whole plan. There is no pan button — panning is a drag or a sideways gesture only — and the reset button stays disabled until the view has actually been changed. The row fades in when you hover the chart or focus one of its buttons, and is permanently visible on touch devices, where there is no hover and the buttons are the only way to zoom without a trackpad. It is drawn at all only when the plan is long enough to be worth zooming into.
A plain vertical scroll is deliberately left alone. The card sits in a dashboard people scroll, and a chart that swallowed the wheel would trap the page the moment the pointer crossed it.
It is forward-only over the plan. There is no history of past plans to
scroll back into: both plan sensors keep their forecast attribute out of the
recorder, so nothing stores what an earlier plan said. The window
therefore stays between now and the end of the plan, and zooming out stops at
the plan's real extent rather than at the configured plot width — past the
optimizer's horizon there is empty chart, not more plan. The reset button
returns to the window the card was configured for.
Panning back through now is different: that is the recorded past, not the
plan's, and the card does scroll back into it — up to 48 hours. Left of the
"now" marker you see what actually happened, drawn to look like the plan: the
measured indoor, lower-floor, outdoor and tank temperatures, the spot price and
the solar irradiance ride the same series their forecasts occupy right of it,
on the plan's own 15-minute steps, in the same style and on the same axes. A
recorded value holds until the sensor next changes, so a stable stretch is a
continuous line rather than a gap; the line breaks only where a sensor was
unavailable for at least a whole step. The heating slots draw from the action
sensor's power_kw, each step the average of what was commanded across it:
on the hot-water series while the pump was in hot-water mode, on the
space-heating series in every other heating mode. The Hot water and Heating
lanes show the runs the pump actually made there, drawn like the plan's own
slots, and while the view reaches into the past the axes also span the plan's
live window, so the past is read on the same scales as the plan beside it. The Actioned power series is a band along the base of the plot
for the hours the pump was executing heating, drawn from the action sensor's
own state history (the mode is the state, so every install has it) — the
power bars are an overlay, never a prerequisite. Hovering the past names the
mode the pump was in. The
history is fetched from Home Assistant's recorder lazily, one 12-hour window
per stretch you pan into, so a quick glance back costs one small request
rather than the whole span. If the recorder answers nothing — it is off, or
the past was never recorded — the card says so in a notice above the chart
and snaps the window back to now rather than show a past it has no evidence
for. Panning back needs the recorder's history API, so a frontend without it
keeps the forward-only pan.
Zooming changes the axis the lanes are drawn against, not just their appearance, so dragging a slot keeps hitting the time under the pointer at any zoom level. Your draft arrangement is read from the published plan rather than from what is on screen, so zooming in cannot quietly drop the slots you cannot see.
Rearranging today's slots
The enlarged view draws today's plan a second time as two editable lanes, hot water above heating. Drag a block to move it, drag either edge to stretch it. Tap or click a lane without moving — or right-click it — and a small menu offers to add a slot at that time, or to remove the one already there. The tap form is not a duplicate: iOS synthesises no right-click of any kind, so without it a touch user could not add or remove a slot at all.
The past is shaded and locked, because it cannot be rescheduled. So is
everything past the point where an arrangement would stop having any effect,
which is the earliest of three limits: 20 hours from now — the window
apply_manual_plan pins for, read from the manual_plan_window_hours
attribute the plan sensors publish rather than hard-coded in the card — the end
of the published plan, and the right-hand edge of the window you are currently
looking at. When it is the zoom rather than the plan or the 20 hours that is
cutting editing short, a » appears at the end of the lane and a line under
the lanes says so, with a show the whole plan button beside it. Dragging a
slot against the edge pans the window along with it.
Underneath, a running total prices the arrangement against the plan currently in force, in the currency resolved above. It updates as you drag, so the cost of moving the tank reheat out of the evening peak is visible before you commit to it.
Apply this plan sends the arrangement to apply_manual_plan, which pins it
for the next 20 hours. The optimizer keeps re-solving as prices and weather
move, but it must schedule around your slots rather than through them. Undo
throws the draft away, and once an override is in force a banner reports when it
expires and offers Back to automatic.
The 20 hours run from the moment you apply, and applying again restarts them — so a plan made at nine in the evening lasts until five the next afternoon rather than expiring three hours later. That is why the chart stops you dragging a slot beyond the window: past it the pin has no effect, and showing a slot as pinned when it does nothing would be worse than not offering the gesture.
It is deliberately 20 rather than 24. The optimizer plans 24 hours ahead, so a full-day override would cover every step it was looking at, and re-applying each day would leave it nothing to decide — switching it off while appearing to leave it on. At 20 there is always a few hours' tail the optimizer still owns.
One thing the card is deliberately honest about: applying a plan does not guarantee every slot runs exactly as drawn. You control timing; the safety limits still win. If your arrangement would let the tank fall below its minimum, miss a legionella cycle, or take the house under its comfort floor, the integration releases just the slots it has to and says so in the banner. Silently freezing the house to honour a drag would be the wrong trade.
Editing without a pointer
The lanes, and the editable slots on them, are real focus stops: each is a
role="button" element carrying a spoken label — "Heating lane. Press Enter to
add a slot", or a slot's own start and end times. Tab to one and:
- Enter or Space opens the same add/remove menu the pointer gets.
- Delete or Backspace removes the focused slot outright.
- Escape dismisses the menu, however it was opened, and returns focus to where the menu came from.
Dragging has no keyboard form; add and remove cover the same edits in more steps. Every edit redraws the chart, which destroys the element that had focus, so focus is deliberately moved to the lane the edit happened in — the acted-on slot either is gone or has a new index — rather than being dropped back at the top of the document. Escape puts it back on the slot the menu was opened from.
Locked slots are left out of the tab order and stay presentational: there is
nothing to do with them. The chart itself is role="img" while it is only a
picture, and role="group" once the lanes put focusable slots inside it, so
those slots stay in the accessibility tree instead of being flattened away.
Schedule editor and what-if simulator
The enlarged view also carries an editor for the heating day, the hot water
windows and two temperatures. It is shown by default and hidden with
what_if: false, which hides the slot lanes too.
The temperatures live in a section of their own: the comfort temperature the house is held at during the heating day, and the minimum hot water temperature the tank may fall to inside a demand window. They are grouped because a lone temperature slider inside a section about scheduling reads as a stray control with no context. The hot water minimum is capped a few degrees below your setpoint so the tank keeps a band to work in — the cap moves on its own when you change the setpoint, and a saved value above it is lowered with a visible note rather than silently.
Each hot water window carries a day selector — Every day, Weekdays or
Weekend — so a household whose mornings differ can say so from the card, in
the grammar the integration's weekly windows use. A schedule typed in
the options flow with specific days (Tu-Fr 06:00-08:00) shows that day list
as the row's own choice and is saved back unchanged. The editor pre-fills from
the configured schedule the plan sensors publish as dhw_windows_spec, not
from the plan's reading of it (dhw_windows), which on a weekly schedule is
one day's windows; an integration that publishes no spec, or an install with
nothing configured, still pre-fills from the plan. Per-weekday overrides —
the seven one-day fields on the Hot water options page — sit outside this
editor: it saves the schedule it shows, and what it shows is the ordinary
spec. When overrides are in force the plan honours them instead, and the
resolved band on the chart is what follows
that.
Directly under those hot-water rows sits a Silent windows list. Each row
is the same day selector, start, end and remove, plus an action: Silent
or Off. Silent caps the compressor in those hours at the power-fraction
slider that appears under the list whenever any row is Silent (the existing
silent_mode_power_fraction, 0.6 to 1.0, pre-filled from the plan sensor).
Off means the plan schedules no space heating and no hot water in the window;
nothing extra is written, and those steps are ordinary idle. An Off row may
not overlap a hot-water window on the same day; Silent may. Silent and Off
may not overlap each other. The card refuses those overlaps before it calls
the host. A Silent row the backend cannot enforce (no writable silent
control) is marked on the row. Switching the optimizer off inside a window
undoes nothing.
The heating-power panel draws the resolved silent and off steps as a band
along the top of the panel, from the plan sensor's quiet_actions.
Editing only builds a draft inside the card. Two buttons act on it: Simulate
these slots prices the draft against the plan currently in force, and Save
as my schedule writes it into the configuration through apply_schedule,
after a confirming second press.
Setpoints are otherwise chosen blind: the optimizer can price a plan, but you never see the price of your own comfort choices. This turns "I set 21 because it sounds about right" into an informed decision.
Each answer is a real optimization solve on the Home Assistant host. Both temperature sliders are debounced in the card — sharing one timer, so two drags cannot race and report the price of the previous one — and the solve is rate-limited in the integration, so dragging cannot trigger one per pixel. It runs against a copy of your configuration, so an exploratory drag never disturbs actual operation.
The overlay is a native <dialog> shown with showModal(), so it renders in
the browser's top layer and cannot be clipped by a dashboard column or hidden
behind another card.
It is laid out as a column bounded by the viewport: the title and legend keep
their place, and everything below them scrolls when it does not fit. The chart
keeps its exact aspect ratio rather than being squeezed to fill the space, since
it is drawn with preserveAspectRatio="none" and constraining its height would
stretch every axis label sideways.
Nothing in the sizing guesses how tall the surrounding chrome is, so a panel that does not fit costs a scrollbar, never content spilling outside the dialog's own background.
The savings page
The Savings tab opens on the last closed month's receipt: its total,
what it saved against a plain thermostat, and one row per billed line with
the basis it was priced on: spot energy and the grid energy fee in kWh, the
capacity charge at the month's billed peak, the kWh a resistive heater drew
beyond what the compressor can (the pump's own tank booster or backup heater
while its flag is on, or an immersion heater you have declared), and
compressor wear in starts. The total adds those lines and nothing else; a
note under it says which lines it covers and that the savings figure
compares spot cost only. Wear reads "not priced" until you set a
compressor replacement cost. Beside it, Where the money went splits the
spot line by the plan's reason for each kWh, largest first; the bars add up
to the spot line. Every receipt the integration keeps (24 months) is on the
Plan Monthly Savings sensor's receipts attribute.
Yesterday: the plan against reality follows. The integration keeps the first plan it solves after midnight as that day's promise. The next day the page draws that promise dashed and the measurement solid on a shared time axis: indoor temperature in the house colour, and cumulative cost in the price colour. One sentence gives the average gap and the cost against what was promised. Without a power meter the cost is not measured, and the page says so. An interval the accuracy record skipped, such as an open window, is missing from the measured lines. A restart that misses the midnight hour leaves that day without a promise, so the next day shows no replay.
Under both, the table settles the months so far: for each
month the conventional baseline, what the metered energy cost, the difference
and its percentage — the same savings_months rows the Plan Monthly Savings
sensor publishes, so the page can never disagree with the entity. Every column
is on one basis: the intervals a plan covered, at spot price plus the grid
energy fee. The baseline is a plain thermostat over the same prices, hot water
kept hot around the clock, run at the power levels your heat pump's meter
recorded rather than the model's; capacity and wear are the receipt's, in
neither column. At one flat price the difference is energy alone. The savings column
carries a bar scaled to the biggest month in the table, which answers "compared
with the others" without quoting a target the page does not show. The open
month is an estimate until it closes, and is badged as one; a month with no
settled rows yet says so in words rather than drawing an empty table. The
baseline has no wood, so where wood is configured the receipt and the table
both say the saving includes heat from wood and that firewood's cost is not
counted. On a wood house the baseline is scaled to the meter over the hours
wood did not heat, and only where too few of those were metered is it scaled
by the whole month, upwards only. A month whose booked baseline used under
half the energy the meter recorded (METER_FLOOR in ledger.py, over at least
1 kWh metered) keeps its two columns and states no saving, with the reason in
the table and on the receipt. That is a low-side check, not a validation of
the figure: a baseline above it can still be wrong.

The advisor page
The Advisor tab is an inbox: what the integration would change to make your plan cheaper, ranked by what each change is worth per month.

Every figure is an estimate (it reads "≈") and comes from the integration's own advisor sensors, not from the card.
Worth doing reads the advisors that are on by default:
- A missing sensor. The unconfigured slot that costs most, with its monthly cost, priced at what a kWh has cost over this month and the last (the mean spot price plus the grid fee paid), so the hour you look does not move it. Assign sensor opens the Setup page's assign picker for that exact slot.
- The hot-water setpoint. The cheapest setpoint that still covers your
heaviest draw, priced against the setpoint you run, at the same recent kWh
price as the missing-sensor row (a fresh install, with none yet, uses the
price list it has). The advisor sweeps
setpoints two degrees apart, so a setpoint between two of them (the default
55 °C) is priced by interpolating between its neighbours. Apply writes
the recommended setpoint, not that interpolated price, through
apply_schedule, which stores it in the configuration so a reload keeps it. - The price of a degree. What keeping the house a degree cooler would save a month, and what keeping it a degree warmer would cost, from the score sensor's price tiles: the whole comfort schedule moved one degree and held there, which is a degree of room temperature, not of the setting (the plan may let the room follow a moved setting by less than a degree), averaged over the last 30 days, so one unusual day moves it by a thirtieth. The figures are checked before they are shown: a degree cooler must save and a degree warmer must cost. The two need not match: each is averaged over the solves that priced it, and they are priced in turn, so they differ by a few units either way. A pair that fails is shown without money, as not settled yet; a degree cooler that saves nothing (no heating) is no row. Try in what-if opens the Plan tab's what-if panel with the comfort slider on the cooler target and runs the simulation; that panel prices the plan from the house as it is now, so its figure includes the one-off coast or heat-up a change starts with. The tiles exist only while the integration's price-tiles option is on; with it off the row is offered under More advice, once turned on instead.
- The valve target. The mixing valve's recommended target, which carries no
money figure and so follows the priced rows. Apply appears only when the
valve holds a manual setpoint, and calls
assign_entitywith it. - A feedback sensor. Shown only when the install has no heat pump power
entity (
heat_pump_power_entity), no energy entity (heat_pump_energy_entity), no compressor frequency entity or sensor (compressor_freq_entity,compressor_freq_sensor) and no water flow sensor (flow_meter_entity): without one of them the planner cannot see what the pump really draws. The row names the four classes and the config key each would use; any one is enough. The row names the options step that holds them (Configure → Advanced settings → Power and solar sensors); Open settings opens this integration's entry, whose Configure starts that flow, and Dismiss hides the row in this browser.
A row reads its own state: an advisor still learning says what it is waiting for, and one that is unavailable says "This advice is unavailable right now". Home Assistant hides an entity's attributes while it is unavailable, so that row has no reason to show. When there is nothing to do, the page says "Nothing to do: the plan is already as cheap as your settings allow."
More advice, once turned on offers the price of a degree (while its tiles are off), wood-stove timing, fuse size and compressor frequency. These advisors are off by default, so the card never reads them. Home Assistant has no link into one step of an options flow, so each row names the step that turns it on (for example Configure → Savings vs comfort for the price of a degree), and Open settings opens this integration's entry, whose Configure starts the flow.
Below the inbox, the page still ranks the temperature sensors you have not configured, the way it did before:
- Each ranked row carries its spread and an estimated badge. The spread is in degrees the model's predictions can move — one unit, comparable between sensors. The line under the heading names what drove the replay: your install's measured delivery where there is history, configured defaults otherwise.
- A sensor the estimate cannot price is listed below the ranked rows, with its reason — the outdoor probe whose job the weather entity already does, the floor-return probe that feeds a state estimate rather than a learned parameter, the hot-water probe whose learners fit quantities this estimate has no band for. Listed rather than hidden, so a sensor you know is real cannot look forgotten.
- Clicking a row acts. The row opens the Setup page's assign picker for that exact slot, pre-opened — the one editing lane the card already owns. Adding the sensor is still your choice; the picker can be closed empty.
When every optional temperature sensor is already configured, that part of the page says exactly that; the integration publishes no ranking at all, and no empty table is drawn.
The health page
The Health tab answers "is the plan running on good data?" in one screen, and the dialog's header carries a pill that says the same on every tab: All inputs fresh, or 1 input problem / N input problems in the warn colour. It counts every input the Input Problem sensor lists, whatever the problem (stale, unavailable, out of range, ...); the input's row on the Health page names which. The pill appears once that sensor has a state.

Everything here is read from the integration's sensors; the card computes no figure of its own. The page shows, top to bottom:
-
Plan, beside Still learning. The plan row says when the plan was solved, when the next solve is due, how many steps it holds and how long the solve took (the Optimization Status sensor's
solve_time_ms). Its pill reads Stale once the plan is past the limit the header's own status pill uses. Still learning lists the sensors that are enabled by default and wait for evidence, each with its reason in words: savings (the first settled month), heat pump COP (a power meter, then some running time), prediction accuracy (the first scored interval) and the optimization score (the first scored day). Home Assistant hides an unavailable entity's attributes, so the card cannot read the sensor's ownwaiting_forcode and the reason is keyed by the sensor. A sensor that has a value is not listed; with nothing waiting the block is absent. -
Inputs. One row per input the integration has read, with its age. A failing input says what is wrong in words (stale, unavailable, entity not found, not a number, outside its plausible range, unrecognised state, not a yes/no flag) with its age and its limit, so "2 h 10 min ago, limit 1 h" reads at a glance. A healthy input says how long ago it reported. The rows come from the Input Problem sensor's
problemsandinput_ages_minutesattributes. The integration does not publish which fallback the plan uses for a failing input, so the page does not say. -
What the model has learned. Read from the Learning Model Status sensor's attributes, one row per learner with its value, its evidence in words and a bar:
- House heat loss in W/K and how much faster or slower the house loses heat than the settings estimated. Without a power meter on the heat pump the row says Not observable without a power meter. and its bar stays empty.
- Solar gain as a window scale, with "Learning: 6 of about 30 samples" until the learner has the evidence it needs.
- Lower floor, once learned.
- Hot-water tank cooling in °C per hour, on a plant with a tank.
- Heat pump efficiency: Normal with its COP scale and No sign of degradation. while the COP health watch is quiet, with Measured by the heat meter. where a heat meter measures the COP; Below its own history in the warn colour when the watch raises its alarm. On an install that cannot measure a COP the value is a dash and the row says why: no heat reading, a heat or power reading that is the pump's own estimate, or no power meter (see COP, and the tracking-error gate).
- With internal-gains learning on, Internal gains by hour, a 24-bar strip of the learned gains per hour that names the peak.
The block is absent while the sensor is unavailable. The counts are samples, not days: the learners count accepted observations.
-
Something looks wrong? Download diagnostics saves the integration's diagnostics file for a bug report; if the card cannot fetch it, the button opens the integration's page in Home Assistant, whose menu has the same download. The file holds the last diagnosis, the input states, a plan summary (counts and totals, no per-step series) and the learning view, with the token, the entry name, every
person.*andcalendar.*entity id and the location removed. -
Debug collection. Off until a bug report asks for one: Start records a week of cycles into the diagnostics file, and the row counts the records and the days left. Once it has finished, the first press of Start only warns that starting again discards the finished collection; download the diagnostics first, then press it again.
-
First-plan checklist. Price source connected, weather forecast available (from the Optimization Status sensor's counts), an indoor temperature sensor, and heat pump control connected are ticked from what the card can read; Assign on the power meter opens the Setup page's picker for that slot. The insight sensors that are off by default are mentioned without a count, because the card cannot see which are disabled; Show opens this integration's entity list, disabled entities included, where they can be turned on.
The setup page
The enlarged view's Setup tab draws your heating system as a schematic: each component is a flat card in the dashboard's own surface, border and radius, titled with what it is and listing its sensors. A small disc on each card's top-right corner says what kind of thing it is — a thermometer for outside air, a cabinet with a fan for the heat pump, a bowtie for the mixing valve, a domed cylinder for a tank (with a drop for the hot water tank), a radiator for the upper floor or house, and a slatted slab for the lower floor. Pipes carry small connection dots at their endpoints and a chevron showing flow direction.
When a hot-water coil is configured in the wood furnace tank, the wood tank's disc is a spring, and the hot water tank says in words which of three states the coil is in: refilled through a wood tank coil when the model runs it; coil configured, not modelled when the option is on but the two-tank layout is not (the spring is dimmed and the coil's pipe dashed); and no hot-water coil otherwise. The coil's pipe — mains water on its way into the hot water tank, not heating water — is the one pipe drawn in the accent colour.
Every card ends with a Configure button naming the options page that owns its inputs, for example Heating system and heat storage. Home Assistant has no link into a single options page, so the button opens this integration in Settings → Devices & services, where Configure → Advanced settings leads to the page the button names; the line above the drawing says so once.
These are three real layouts, drawn by the card's own renderer rather than by
hand — HPO_QA_OUTDIR=docs/img/model HPO_QA_PREFIX=hydronic- node tests/setup_qa_render.mjs,
the same script designers use to review the schematic.
One buffer, wood furnace feeding it. The wood tank charges the buffer; the mixing valve serves both zones from there.

Two tanks on a four-way valve. The wood tank feeds the valve directly instead of the buffer, so the valve blends two sources and gains its own target and outlet-temperature slots.

…and the wood tank pre-heating hot water through a coil. The wood tank's disc is a spring, the coil's pipe to the hot water tank is the accent pipe, and the hot water tank says it is refilled through the coil.

Each card stretches with the sensor rows inside it, and every row is an
assignment slot: click a row — or tab to it and press
Enter or Space — to pick the entity that feeds it. Each row is a
role="button" target with a spoken label, and a picker opened from the
keyboard takes focus, so the whole page is usable without a pointer. An
empty slot is a sensor this setup could use and does not have; it is shown
on purpose.
The layout editor works unchanged — dragging boxes and drawing or removing connections re-renders the schematic live, and the decorations get out of the way while you edit: the pipe dots and flow chevrons are hidden so the pipes themselves are easier to grab. Only a drawing that matches a supported layout can be saved, and the page says which one it matched, or what the closest one is missing. Colors follow your Home Assistant theme in both light and dark mode.
Keyboard and screen readers
Everything the card lets you click is a real button: the legend chips, the expand button in the header, the overlay's close button and its Plan, Setup, Savings and Advisor tabs, the zoom controls, and the buttons in the schedule editor. They take focus in reading order and carry spoken labels rather than relying on their glyphs — the zoom controls announce themselves as "Zoom out", "Zoom in" and "Show the whole plan". The time and temperature inputs in the schedule editor are labelled the same way.
The overlay is a native <dialog> opened with showModal(), so the browser
itself keeps focus inside it and closes it on Escape; it is labelled with the
card's title, and its five pages — Plan, Setup, Savings, Advisor, Health — are a
role="tablist" whose current tab carries aria-selected.
The plan's editable slots and the setup page's assignment rows are covered above, under Editing without a pointer and The setup page.
The card's one animation — the zoom controls fading in — is dropped entirely
when the browser reports prefers-reduced-motion: reduce.
Installation
Automatic (recommended)
When you install the integration through the Home Assistant Marketplace (HACS before 2026.11) and add a config entry, the card is served and registered automatically:
- The integration exposes the JS at
/heatpump_optimizer_static/heatpump-optimizer-card.js. - If your dashboards use storage mode (the default UI-managed dashboards), the Lovelace resource is registered for you on setup.
- Reload your browser (hard refresh) so the new resource is loaded, then add a card and pick Heat Pump Optimizer Card. The picker previews it, and picking it opens the card's own visual editor — see Configuring the card in the UI. You can also paste one of the YAML examples below.
If you don't see the card in the picker, hard-refresh the browser (the resource is cache-busted by integration version, but the browser may still hold an old module).
Manual resource registration (fallback)
If your dashboards are in YAML mode, or automatic registration failed for any reason, add the resource yourself.
UI (storage mode): Settings → Dashboards → ⋮ → Resources → Add resource
- URL:
/heatpump_optimizer_static/heatpump-optimizer-card.js - Resource type: JavaScript Module
YAML mode: add to your configuration.yaml / dashboard YAML:
lovelace:
  mode: yaml
  resources:
    - url: /heatpump_optimizer_static/heatpump-optimizer-card.js
      type: module
Restart or reload the dashboard afterwards.
If an upgrade seems to change nothing
Only one copy of the card can be active: a custom element name can be claimed
once per page, and the first copy to load keeps it. A second copy — usually a
manual install left under /local/ — therefore wins
permanently, and every upgrade after it loads and is ignored. New features
appear to be missing even though the files on disk are current.
To check, open the browser console and reload the dashboard. The card prints its version on load:
heatpump-optimizer-card v<version>
where <version> is the card's own version. It is rewritten to match on every
release the integration stamps — the release step edits the card file itself,
so the banner and the integration version move together. If the banner is older than
the integration version you installed, a stale copy of the card is loading.
If it is older than that, or an error mentions a duplicate registration, go to
Settings → Dashboards → ⋮ → Resources and remove every entry for this card
except the one under /heatpump_optimizer_static/. The card itself logs an
error naming both versions when a second copy wins the registration, and the
integration writes a warning to the Home Assistant log when it finds a second
Lovelace resource pointing at another copy of this card file.
Configuring the card in the UI
The card ships its own visual editor, so Edit dashboard → the card's pencil
gives you a form rather than raw YAML. It is defined in the same file as the
card — one resource, no build step, no second chunk that can fail to load on
its own — and is built on Home Assistant's ha-form, so the pickers, toggles
and number boxes are the ones the rest of the frontend uses, themed to match.
The form offers every documented option:
- Title, as free text.
- The three plan sensors, as entity pickers filtered to this integration's own sensors rather than to every sensor in the house.
- Hours to show, as a number box stepping whole hours from 1 to 168.
- Show the schedule editor and Show the headline stats, as toggles.
- Currency, as a dropdown of the likely codes that still accepts any other ISO code typed in.
- Series shown by default, as an expandable group of one toggle per series, labelled with the same names the legend uses.
Field labels follow the frontend language, like the rest of the card.
What it writes back is deliberately the leanest config that means what you
chose. The form shows every default filled in, so a toggle reads as its
effective value; but any key whose value merely restates its default is dropped
before saving, as are emptied fields, and only series you turned off are
stored. Switch to the YAML view afterwards and you see what you actually
changed, not a transcript of every default. The one exception is title: an
empty title is a legitimate setting (it renders no header text), so an
explicitly configured empty title survives edits to other fields.
Configuration options
Everything the editor offers can also be written by hand.
type: custom:heatpump-optimizer-card
title: Heat pump plan                    # optional, default is localized
space_entity: sensor.heat_pump_optimizer_plan_space_heating  # optional, auto-detected
dhw_entity: sensor.heat_pump_optimizer_plan_dhw_heating      # optional, auto-detected
solar_entity: sensor.heat_pump_optimizer_solar_irradiance    # optional, auto-detected
hours: 24                                # optional, hours forward to plot, default 24
what_if: true                            # optional, schedule editor in the enlarged view
show_stats: true                         # optional, headline row under the header
currency: SEK                            # optional, overrides the resolved currency
series:                                  # optional, initial per-series visibility
  price: true
  dhw_slots: true
  space_slots: true
  actioned: true
  quiet_silent: true
  quiet_off: true
  outdoor: true
  dhw_temp: true
  house_temp: true
  solar: true
| Option | Type | Default | Description |
|---|---|---|---|
type |
string | — | Must be custom:heatpump-optimizer-card. |
title |
string | localized | Card header text. Left out, it is the built-in default for the frontend language (Heat pump plan, Värmepumpsplan, Wärmepumpenplan). An explicit empty string renders no header text. |
space_entity |
string | sensor.heat_pump_optimizer_plan_space_heating, else auto-detected |
Entity id of the space-heating plan sensor (its forecast attribute supplies price, outdoor, space_power, room, upper, lower). |
dhw_entity |
string | sensor.heat_pump_optimizer_plan_dhw_heating, else auto-detected |
Entity id of the DHW plan sensor (its forecast attribute supplies dhw_power, dhw_temp, the dhw_temp_lo/dhw_temp_hi expected-error band, and price/outdoor fallbacks). |
solar_entity |
string | sensor.heat_pump_optimizer_solar_irradiance, else auto-detected |
Entity id of the solar irradiance sensor (its forecast attribute supplies ghi). |
hours |
number | 24 |
How many hours forward to plot. Must be from 1 to 168: the visual editor's box steps whole hours from that same floor, and a YAML value below or above the range is refused rather than plotted. |
what_if |
boolean | true |
Show the slot lanes and schedule editor in the enlarged view. Editing is local to the card; only the Simulate, Save and Apply buttons reach Home Assistant. |
currency |
string | plan sensor's, else HA's, else SEK |
Unit shown on the price axis and cost figures. The card first uses the currency the integration publishes on the plan sensors, then Home Assistant's configured currency, then SEK. Only override this if your price feed disagrees with all of them. It relabels rather than converts, and it does not relabel a savings figure: the headline and the savings page keep the unit their own sensor declares. |
show_stats |
boolean | true |
Show the headline row (projected savings, optimization score, plan narrative) under the card header. It hides itself, entirely, when the backend publishes none of those sensors. |
series |
map | all true |
Initial visibility per series key. Keys: price, dhw_slots, space_slots, actioned, quiet_silent, quiet_off, outdoor, dhw_temp, house_temp, solar. |
Entity discovery
The plan sensors pin the object id sensor.heat_pump_optimizer_*, so the
prefix is fixed regardless of the device name. A stock install produces
sensor.heat_pump_optimizer_plan_space_heating and
sensor.heat_pump_optimizer_plan_dhw_heating. Home Assistant keeps an
entity's registry id once it is assigned, so an entry registered with the other
suffix order, ending _space_heating_plan and _dhw_heating_plan, keeps those
ids; the card resolves both.
You normally do not need to configure either option. The card resolves entities in this order:
- The id you configured, if that entity exists.
- Any
sensorwhoseplan_kindattribute isspace,dhworsolar. This is a stable marker published by the integration, so renaming an entity does not break the card. - Any
sensorwhose id ends inplan_space_heating/plan_dhw_heating/solar_irradiance, or in the other suffix order,space_heating_plan/dhw_heating_plan.
If nothing is found the card names the id it looked for, so check Developer Tools → States and set the option explicitly.
Toggle state is remembered in the browser's localStorage, so it survives page
reloads. The key is the space and hot-water entity ids the config carries (the
defaults, when you have not set them) plus the card's title and hours — its
config identity, not just its data sources — so a 24-hour card on a wall panel
and a 48-hour card of the same sensors elsewhere keep their own toggles instead
of overwriting each other. Toggles stored under a key of the entity ids alone
are read once as a fallback, so they are kept.
Writes always go to the full key.
The series option only sets the initial visibility the first time the card
is shown.
Invalid configuration — an out-of-range hours, non-string entity ids or
title, a non-boolean what_if, show_stats or series visibility, an unknown
series key — raises a descriptive error, as Lovelace expects. Those messages are
localized like the rest of the card.
Example configs
Minimal
type: custom:heatpump-optimizer-card
Custom entities and a shorter horizon
type: custom:heatpump-optimizer-card
title: Heating plan (next 12 h)
space_entity: sensor.villa_space_heating_plan
dhw_entity: sensor.villa_dhw_heating_plan
hours: 12
Price and power focus (temperatures hidden by default)
type: custom:heatpump-optimizer-card
title: When will it heat?
hours: 24
series:
  price: true
  dhw_slots: true
  space_slots: true
  outdoor: false
  dhw_temp: false
  house_temp: false
Behaviour when data is missing
If a sensor is missing, unavailable, or its forecast is empty, the card shows
a friendly message instead of throwing. Series whose sensor has no data are
rendered as disabled (greyed-out) legend chips.
Rendered from docs/dashboard-card.md, which is the source of truth; this page changes only when that file does.